“Greater love has no one than this, than to lay down one’s life for his friends” – Jesus Christ, 1st century AD, John 15:13 [NKJV]
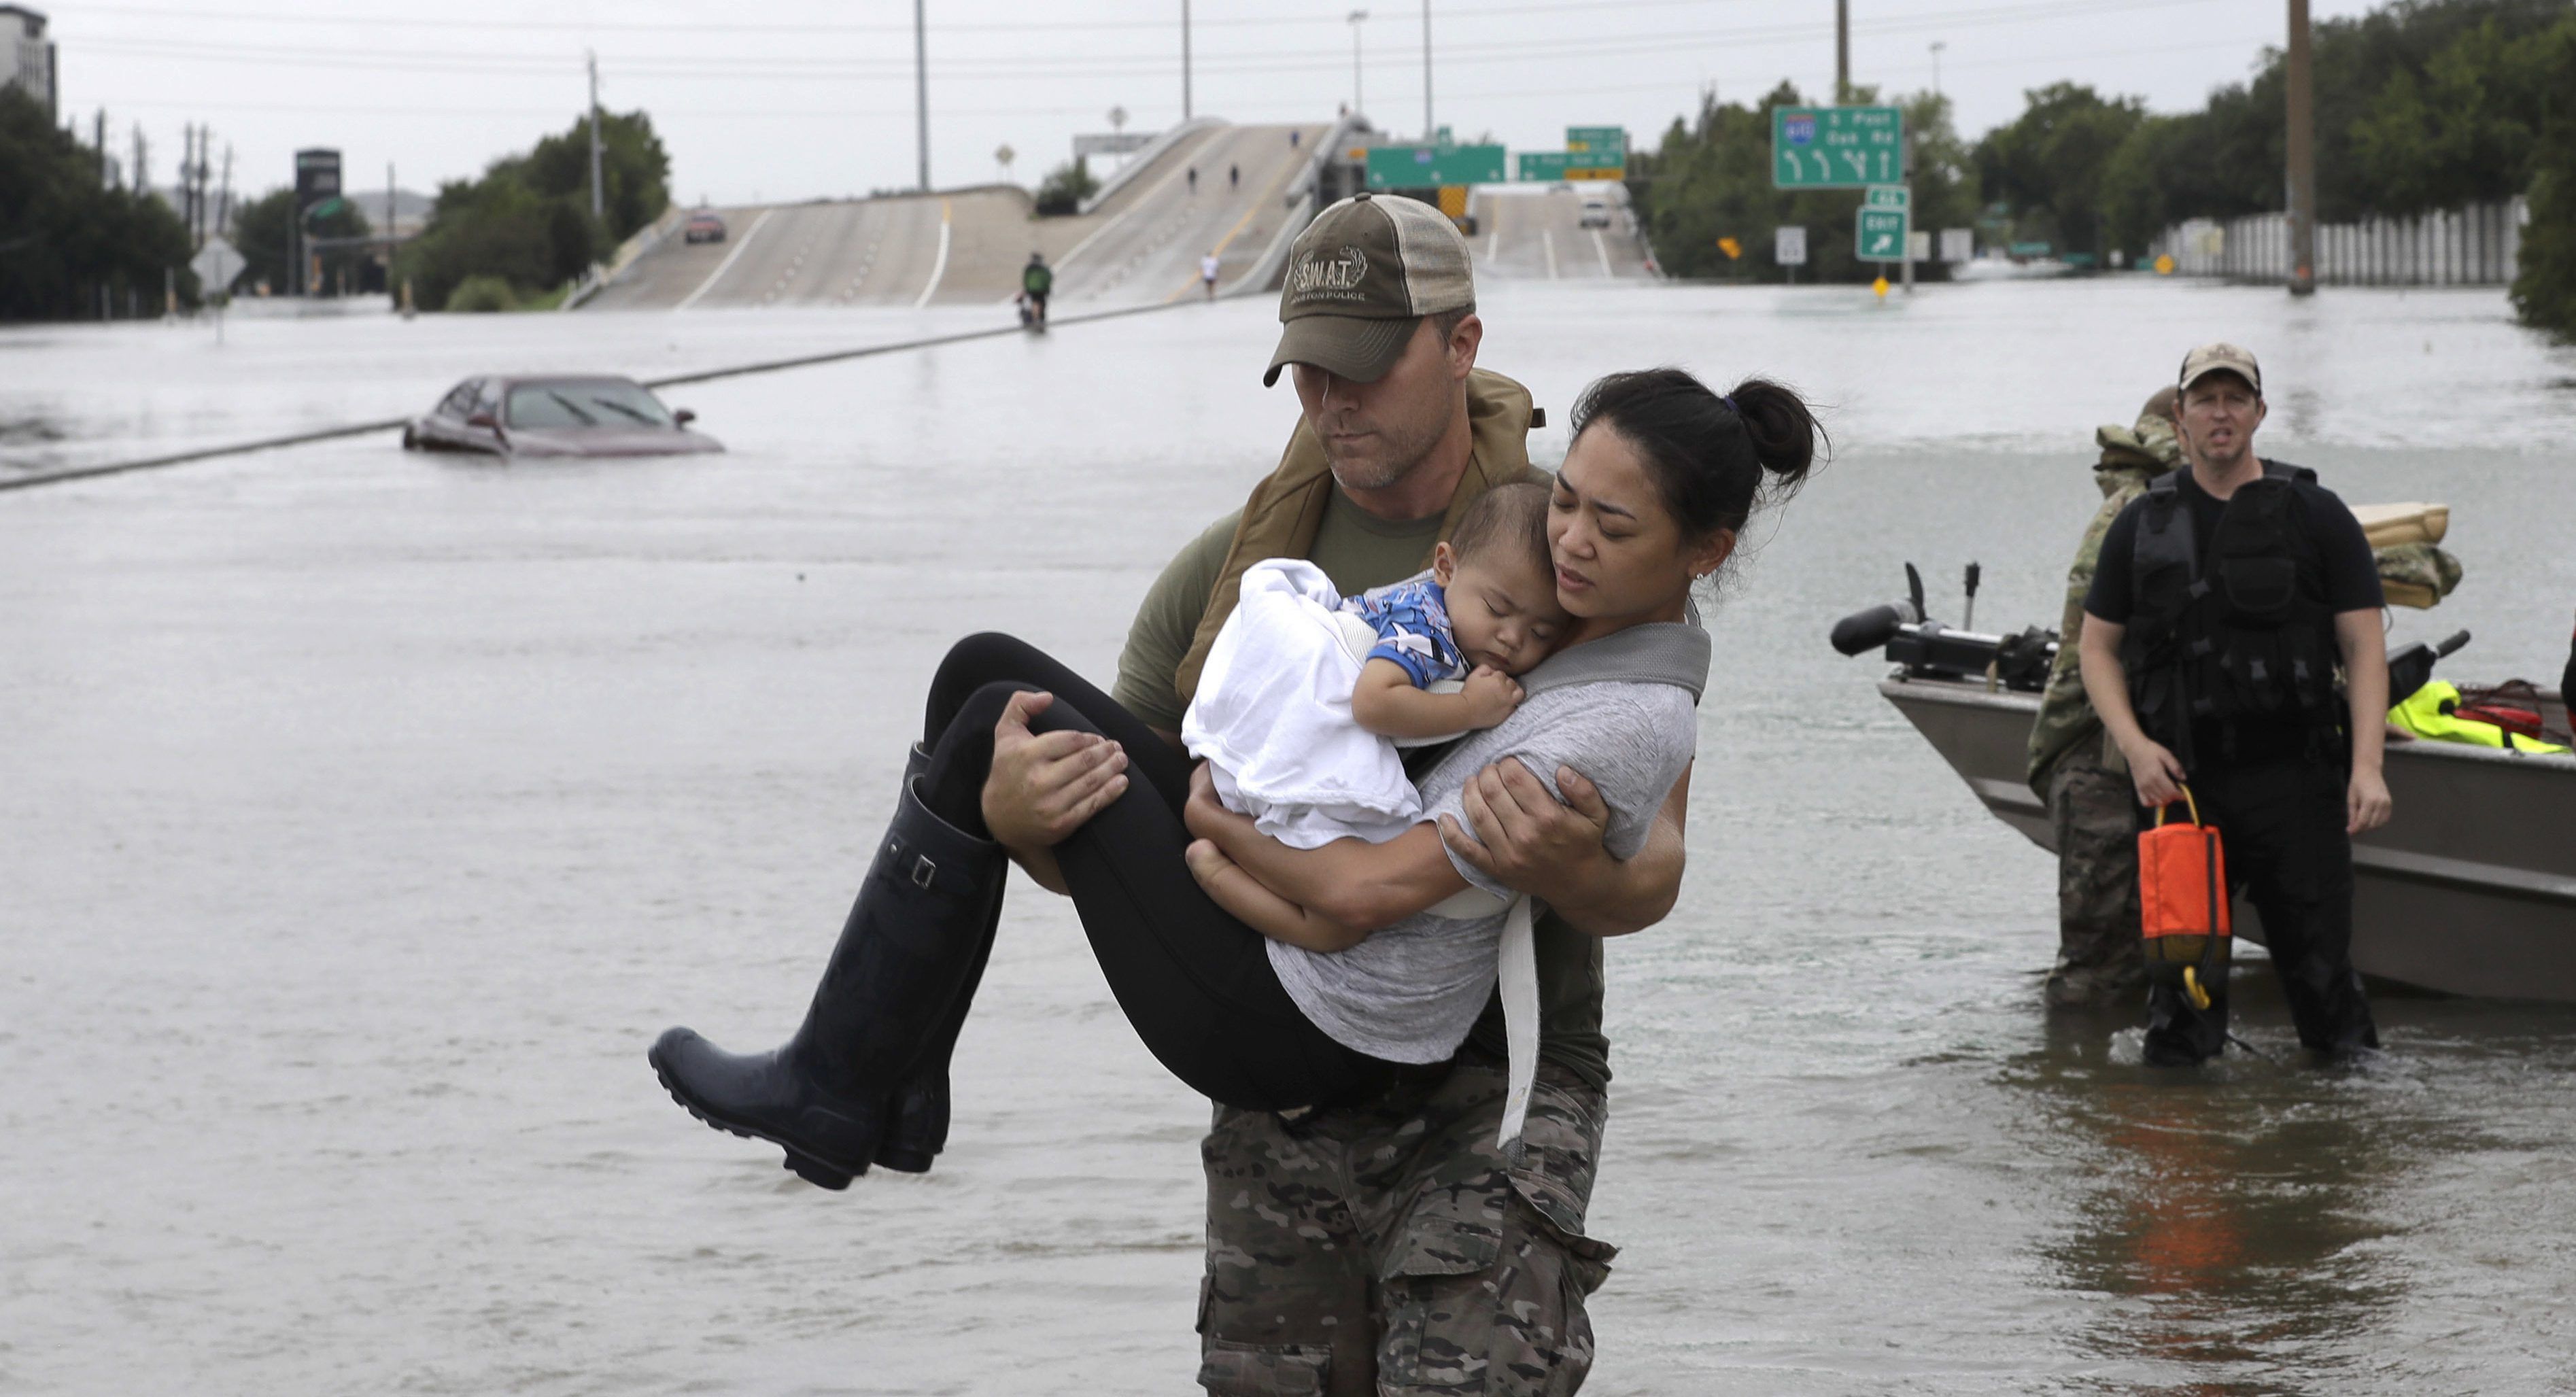
It has been a month now since Hurricane Harvey hit the southern part of Texas, dropping more rain than any storm on record in the U.S. The size and scope are unfathomable when we consider so much change in such a brief time.
15 Trillion Gallons: Putting the Rainfall Total From Hurricane Harvey Into Perspective. Fox 26 Houston, Aug 30 ‘17
Harvey and Irma Economic Hit Could Total $200 Billion: Moody’s, CNBC, Sept 11 ‘17
Yet in the midst of such devastation, we saw acts of kindness, courage, and sacrifice from average Americans.
Yet another storm has been building for years. The numbers it has produced are staggering. Many have benefited; many have not. However, this storm differs from Harvey and Irma. As this storm has grown, we have been told that we were in recovery, yet like a Hurricane, if we track the storm, we see it has been building in strength, not diminishing.
Let me take one factor in this storm.
Since the $700 billion bailout announced 9 years ago in September 2008 to solve the worst crisis since the Great Depression, we have watched an ongoing deluge of “financial rain” (or debt to buy up financial assets). As I write this in September 2017, the global total of this ongoing “temporary assistance” for financial markets is already over 15 times the original US bailout the world heard in September 2008.
One side effect from the storm that has been building over the last decade, is that it has produced the widest financial inequalities between the top 1% and bottom 90% of any decade in American history.
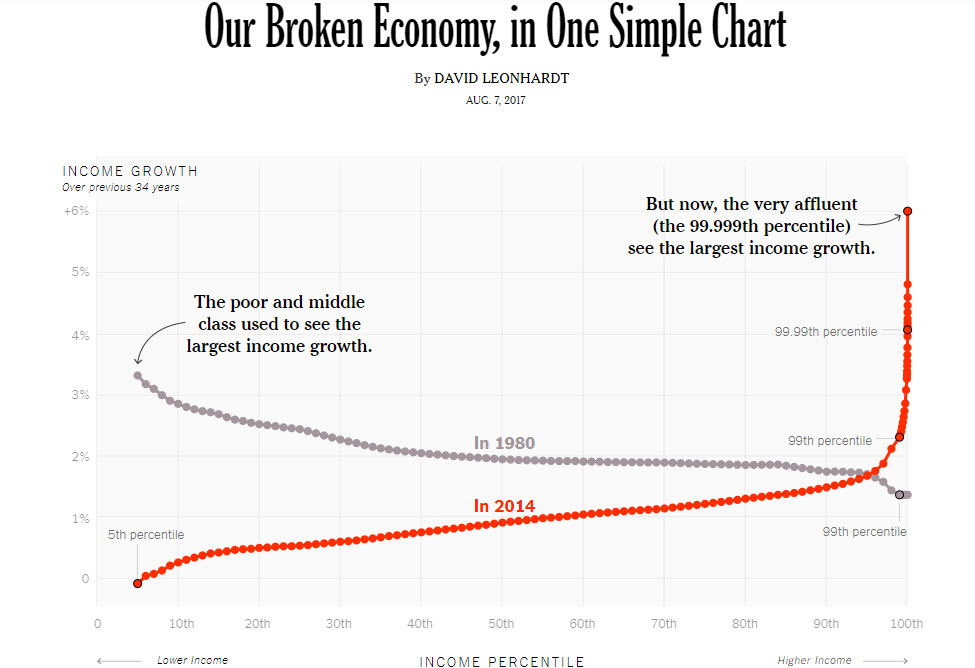
According to an NY Times article, Our Broken Economy in One Simple Chart (Aug 7 ’17), when I was leaving college in the early 1980s, the middle class and poor were seeing their take home paychecks rise faster than those in the top 1%. By 2014, the torrent of debt to inflate financial assets had flipped income growth on its head; the bottom 90% were declining while only the tiniest of percentages at the top saw their incomes leaping.
In the last decade, the huge gap has not between the upper middle class and the middle class, but between the middle class and the group that make up less than 1/100th of the population.
Has history always shown that the number at the top is small and the number at the bottom is large? Yes. However, never has the wealth of the world depended on so much debt created in this short of a period!
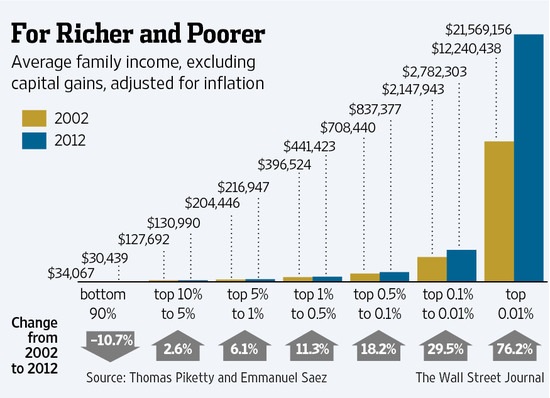
The chart below from the Wall Street Journal is another view of the enormous income disparity that has developed since the “recovery”….and as the chart states, these numbers are now 5 years old, so the widening is even greater in 2017.
So I ask you, have the financial policies followed by the major central banks since 2008 encouraged the idea that all men are created equal?
This short post should not lead one to label the writer as a Democrat or Republican or a Liberal or Conservative, but merely a human being looking at his nation and world and asking questions from the data.
The most powerful force that has elevated the super rich far beyond the rest of the population, whether national or global, has been the Quantitative Easing model followed by central banks. Repeatedly since 2008 we were told this explosion of debt out of thin air, was an attempt to push inflation (prices) higher.
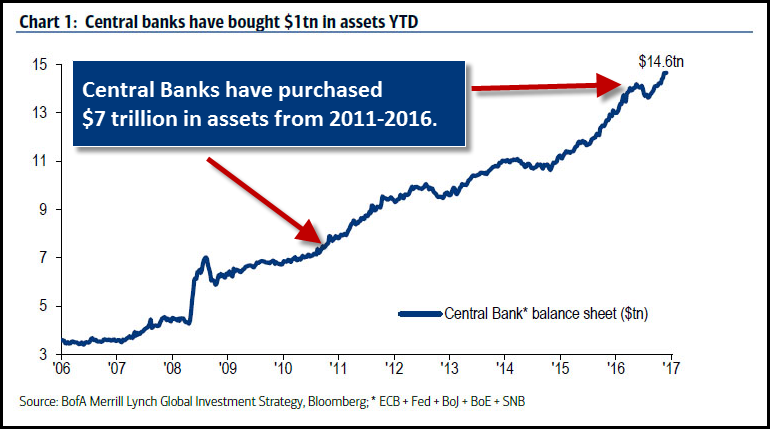
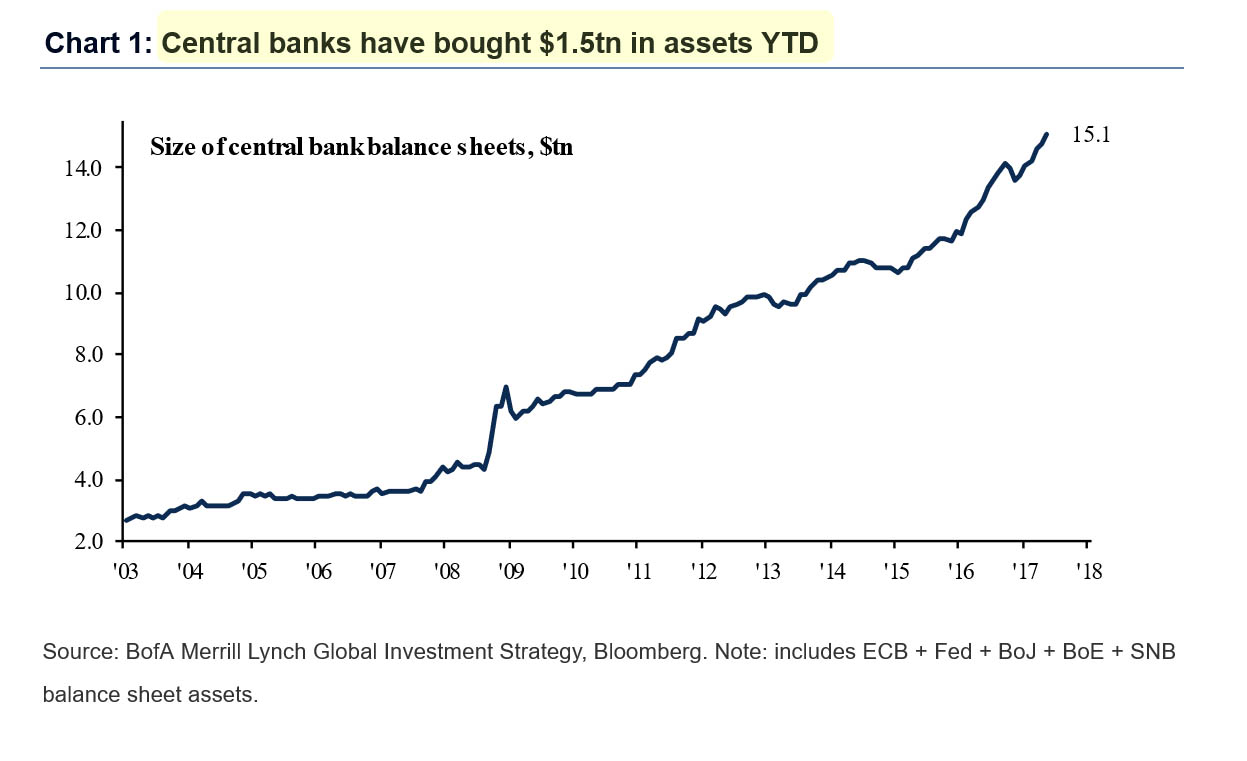
Central banks contributed $7 trillion to BUY ASSETS (chief recipient of the inflation) across the world between 2011 and 2016. YTD an additional $2 trillion has poured into the global financial system to continue this scheme. Keynesian central planning economists call this “the wealth effect”.
BofA: $2 Trillion YTD in Central Bank Liquidity is Why Stocks Are at Record Highs, Zero Hedge, Sept 15 ‘17
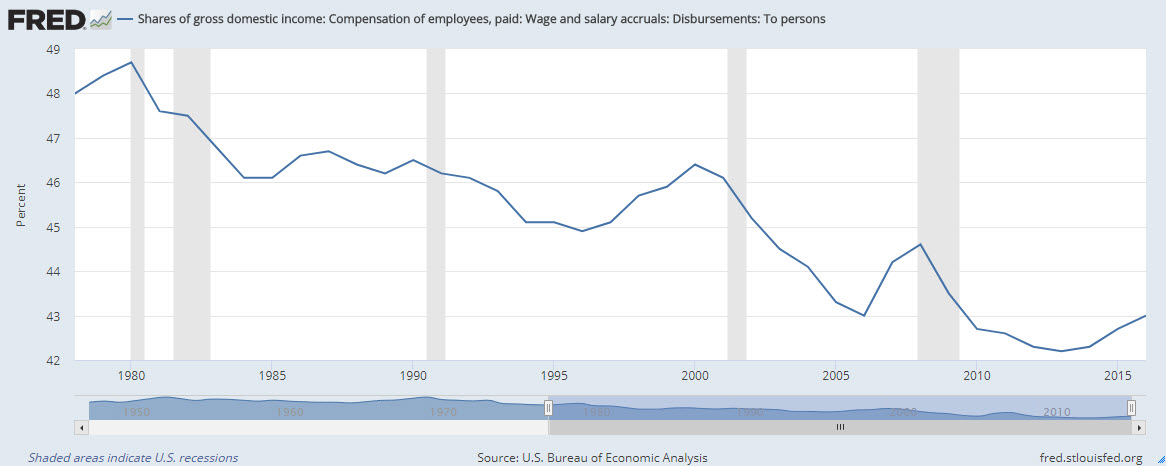
But has all this debt, funneled into financial markets producing the second longest bull market in US history, produced rising wages, leading to more spending, or have debt levels increased as wages have declined since 2009?
Wall Street Hits Record Highs, S&P 500 Pierces 2500, Reuters, Sept 15 ’17
Consumer Debt is At a Record High, Haven’t We Learned?, Washington Post, Aug 12 ’17
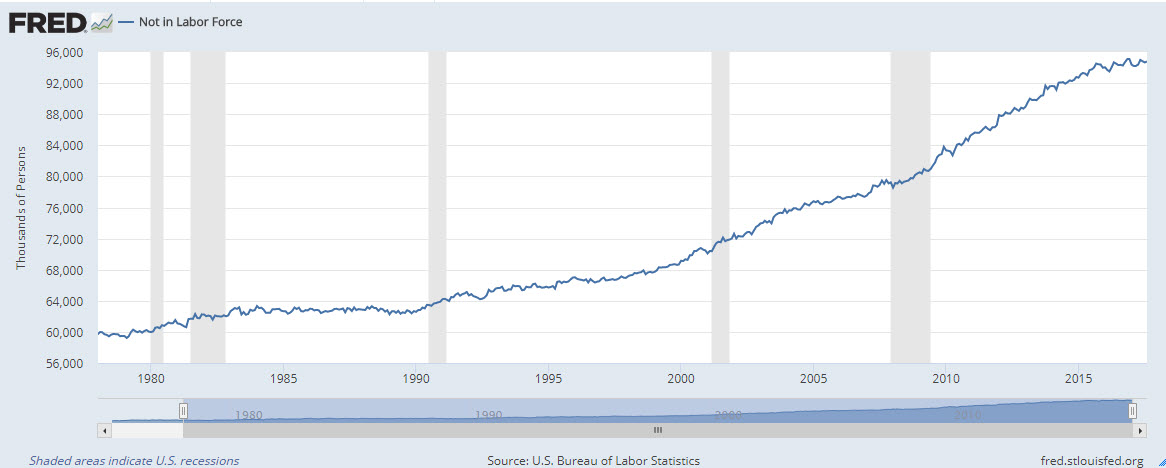
How can a nation believe “all men are created equal” when month after month their stock markets produce all time highs, yet their economy produces all time highs in the number of Americans out of the workforce?
Yes millions are retired, but with 97 million Americans living paycheck to paycheck, and adults between the working ages of 15 and 64 at 205 million, one can not conclude that overall, the American society is fiscally better off today than when we were lead to believe a $700 billion bailout was enough.
Bush signs $700,000 Financial Bailout Bill, NPR, Oct 10 ’08
Five years after the S&P 500 bottom in October 2002, the public saw that $8 trillion in stock market wealth had been created. 13 months later, the entire $8 trillion was gone.
Since March 2009, we have seen US stock wealth climb $19.2 trillion as of September 20, 2017. We can see from the chart below, 5 of the central banks in the world have grown their balance sheets over $11 trillion since the summer of 2008. This had never happened until the 2008 crisis. The debt used to buy these assets and “assist” market prices for 9 years has not gone away.
Are tens of millions of Americans, whether rich, poor, or middle class preparing for the next major financial storm? Will we talk, listen, and work together as this storm sets in, or place our hope in more debt and more “assistance” from our government, who itself sees debt as “unlimited” and the Federal Reserve as the force to calm the financial wind and waves.
“We hold these truths to be self-evident, that all men are created equal, that they are endowed by their Creator with certain unalienable Rights, that among these are Life, Liberty and the pursuit of Happiness.” – The Declaration of Independence, 1776
A Curious and Confident Mind


