Tag Archives: Dow

Big Bear Bond Trend

When we hear that the market was up or down, instinctively we think of the US stock market and the Dow.

Yet, according to the SIFMA (Securities Industry and Financial Markets Association), as of July 2025 the global fixed income markets increased to $145 trillion while global equity market capitalization increased to $126 trillion.

In this post, we will look at long- term bond trends from major nations at the top of the global bond markets. We must all remember that the history and science behind a highly leverage system of debt-based money must be understood in context of current commentary and events.

The Historical View

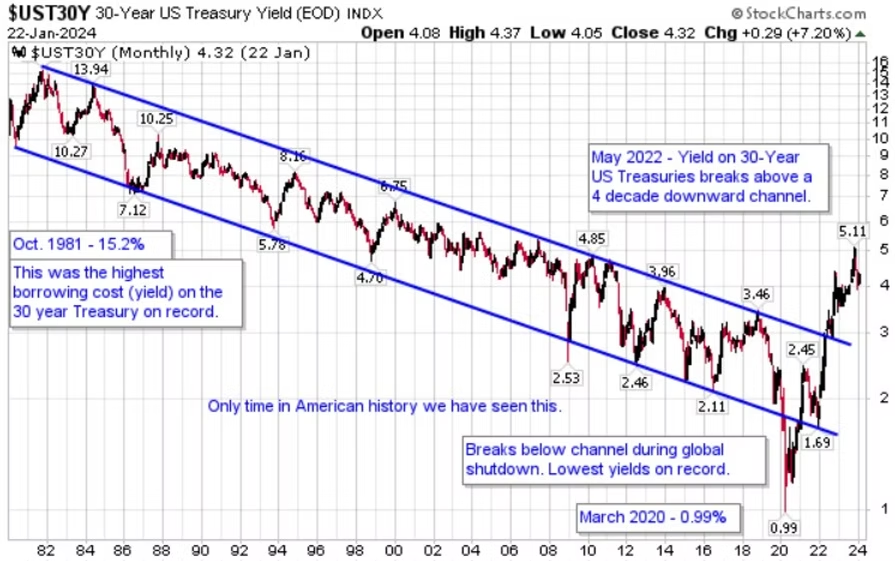
First, we will look at the 30-year US Treasury bond market. The chart below was pulled from my January 2024 Best Minds Inc blog post.  

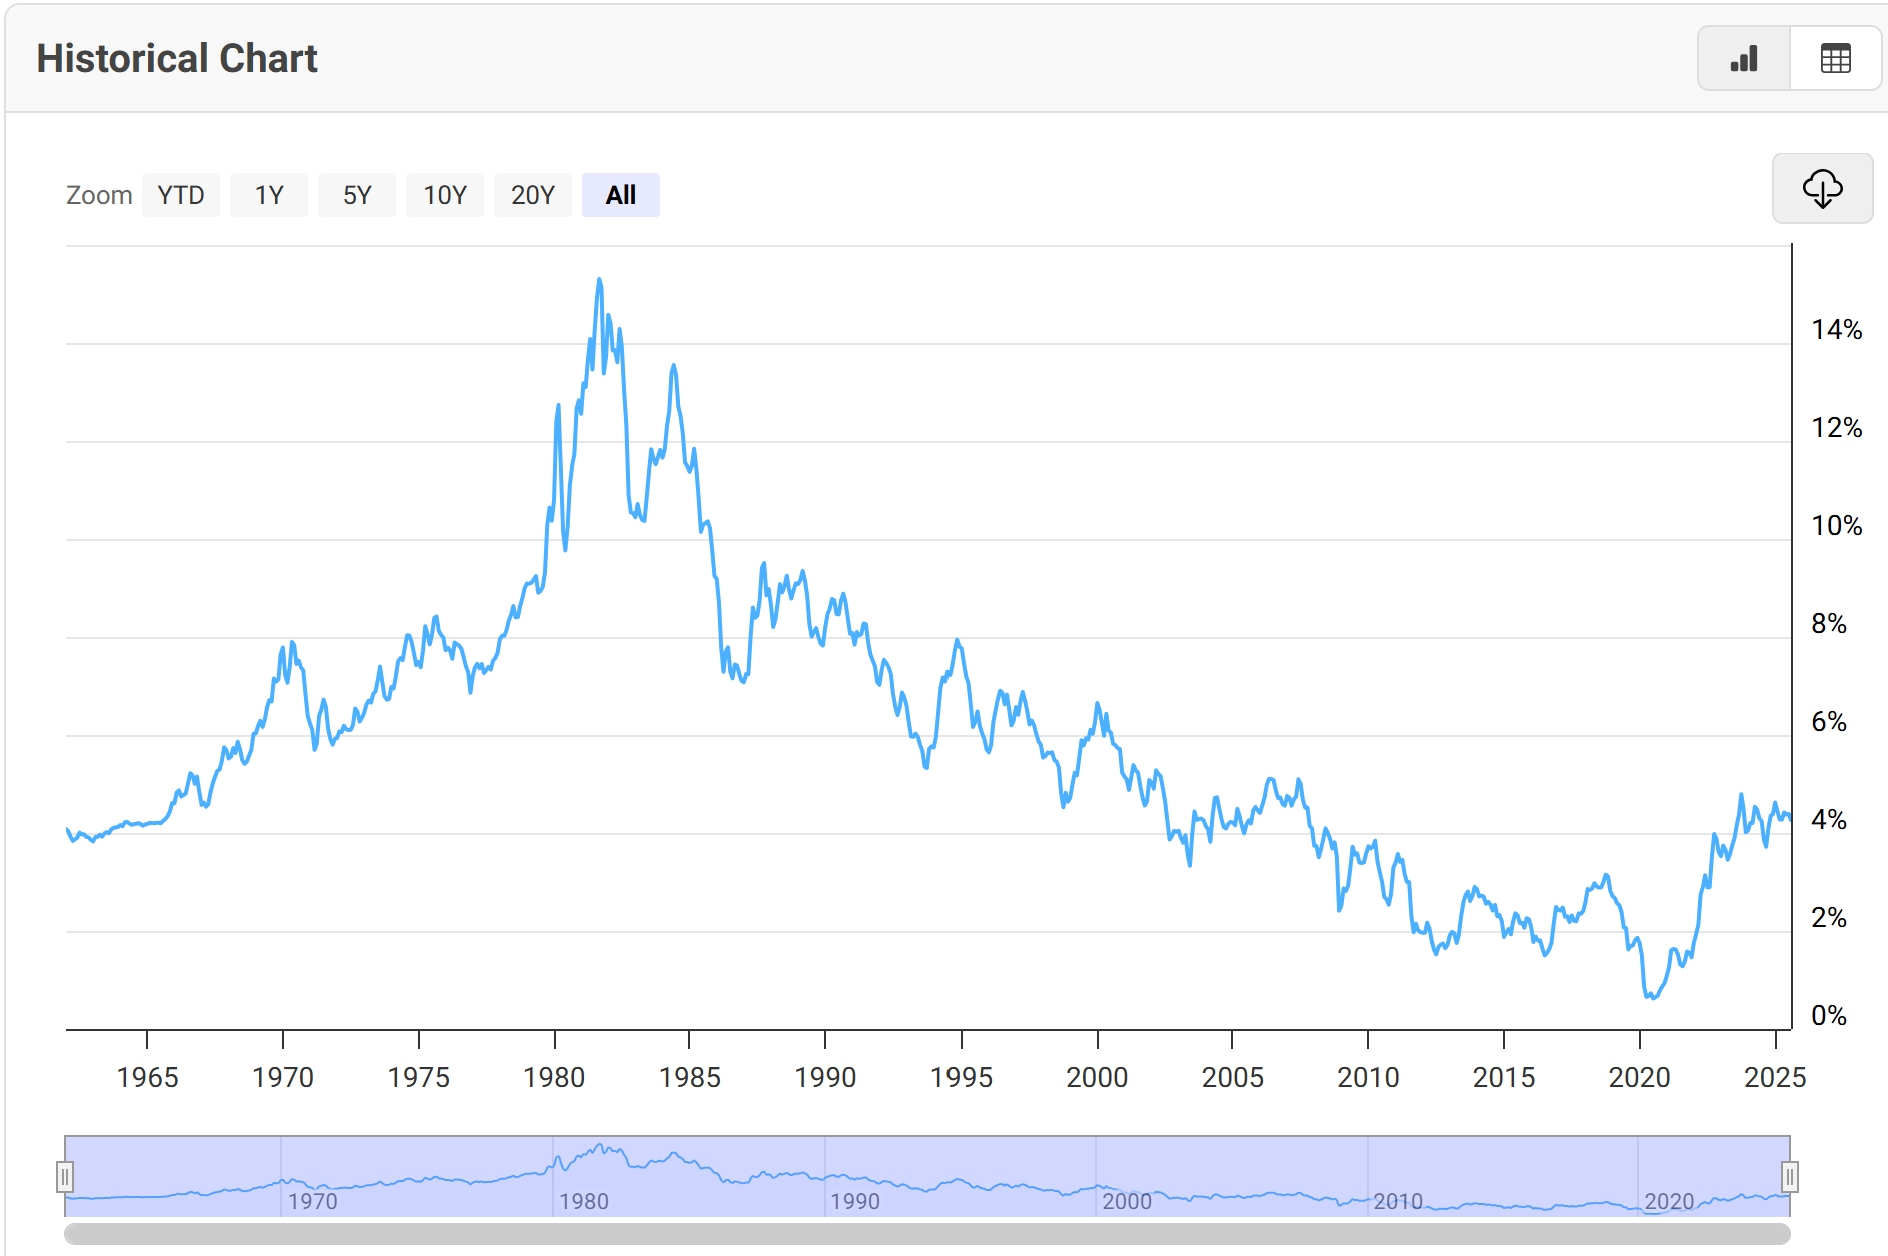
[Source: Macrotrends: 10 Year US Treasury Bond Yields, 1962-2025]

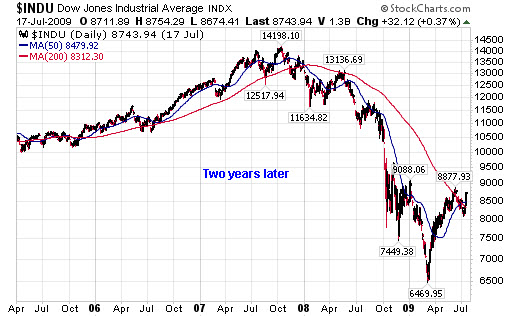
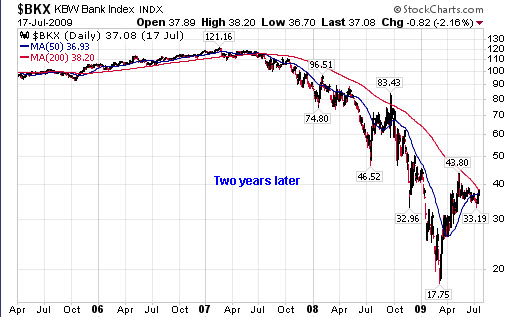
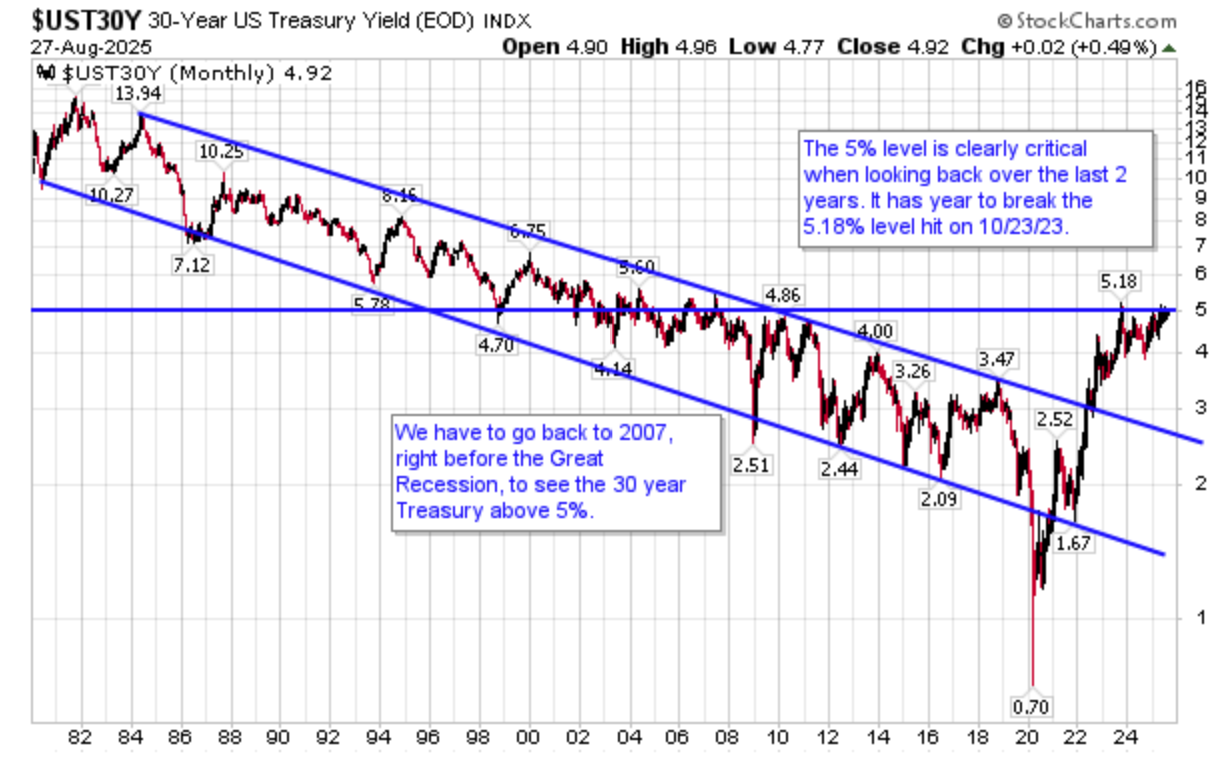
No one can look at the three charts above without seeing that the lowest yields in the U.S. 30 Year Treasury bonds took place in 2020. If you went back since the 1700s in America history, you would know that in the fall of 1981 US Treasury yields reached their highest EVER. What were you doing in 1981? I was working on my master’s degree, with no clue that a major historic event was taking place.

As yields moved lower, borrowing costs declined. This made the older bonds in this trend more valuable; holding a 10% bond became more valuable than an 8% bond and holding an 8% bond more than a 6% bond. You get the drift.

But eventually, we had to reach a historic low in what was almost a 40-year trend.

To show how extremely rare this low in 2020 was for bond yields, we will go way back in history.

So, what could ancient history teach us?

The following, in my opinion, is a quote from the best book ever assembled on bond yields and returns, A History of Interest Rates. My version is the third edition, revised (1996). The original, written by Sidney Homer with Salmon Brothers, came out in 1969. Homer starts his book with Mesopotamian Interest Rates between 3000-400 B.C. Yes, a very long time ago.  

“In the Sumerian period, 3000-1900 BC, the customary rate of interest for a loan of barley was 33 1/3% per annum and for a loan of silver was 20% per annum.” [pg 29]

Humor me for another moment before we leap back closer to our time.

“One-half mina of silver, the possession of Nabu-Usabsi….is owed by Nabu-sar-ahesu…Yearly upon one mina, ten shekels of silver shall accumulate (16 2/3%). Another credit has no right of disposal over it until Nabu-Usabsi gets his money, full repaid. The men he caused to appear [4 witnesses, the priest] City of Urak, month of Ululu, 11th day of the 9th year of Nebuchadnessar, King of Babylon” [pg 29]

This loan was made in 595 BC, 9 years before Nebuchadnezzar’s army conquered Judah and took Jersualem:’

“Now when Jerusalem was captured in the ninth year of Zedekiah king of Judah, in the tenth month, Nebuchadnezzar king of Babylon and all his army came to Jerusalem and laid siege to it; in the eleventh year of Zedekiah, in the fourth month, in the ninth day of the month, the city wall was breached.” [Jeremiah 39:1-2]

No zero or negative interest rates here.

Now, back to a time closer to home, American history.

Low rates before the 21st century in America

Homer has a chart of long-term American bond yields between 1798 to 1981. During this extremely long period, the lowest annual yields were 2.53%. He also states that, “In 1946, the lowest bond yields in history were reached. Prime corporate bonds averaged a yield of as low as 2.37%; one issue of long taxable government bonds sold to yield as little as 1.93%”. [bold mine]

I am taking us back through HISTORY to point out something you may have never heard or read. What we saw around the world in the last decade were THE lowest yields ever.  

Anyone understanding the HISTORY of bonds and loans spanning centuries and millennia, understands the total insanity of central banks a few years ago talking about negative interest rates and tools as though these “leaders of finance” could stop the eventual RISE in yields and DECLINE in bond values. Market trends, like life on this old planet, never go on forever.

Japan: Let’s Buy Our Way Out

If you asked anyone from any culture, “Is there such a thing as unlimited debt without consequences?”, they would say NO. If you asked them about the “unlimited debt” concept from the central banks around the world, they would probably dismiss the question and end the conversation.

In April of 2013, the Bank of Japan began buying large amounts of their own bonds as part of their “monetary easing” policy. At the time, the BOJ owned 11.5% of all Japanese government bonds. By the end of 2022, they owned just over HALF of their government’s bonds, an increase of more than 4-fold in one decade. The wizards of central banking in Japan managed to sell the idea of “negative rates” for a short period of time by telling banks and consumers to BORROW more money as a way everyone would stimulate the economy, while banks and savers HOLDING higher reserves for safety were punished. It was an experiment in changing human behavior. To tell people in debt, “Take on more debt and go spend more, we will lower your rates”, while telling those with savings and more frugal, “you will be punished for being prudent”, was a policy doomed to fail.

[It’s Official: The BOJ now owns more than half of Japan’s bonds, The Asahi Shimbun, Dec 19, ‘22]

The Bank of Japan (BOJ) ended eight years of negative interest rates and other remnants of its unorthodox policy on Tuesday, making a historic shift away from its focus on reflating growth with decades of massive monetary stimulus.

While the move was Japan’s first-interest rate hike in 17 years, it still keeps rates stuck around zero as a fragile economic recovery forces the central bank to go slow on further rises in borrowing costs, analysts say. [Bank of Japan scraps radical policy, makes first rate hike in 17 years, Reuters, March 19 ‘24]

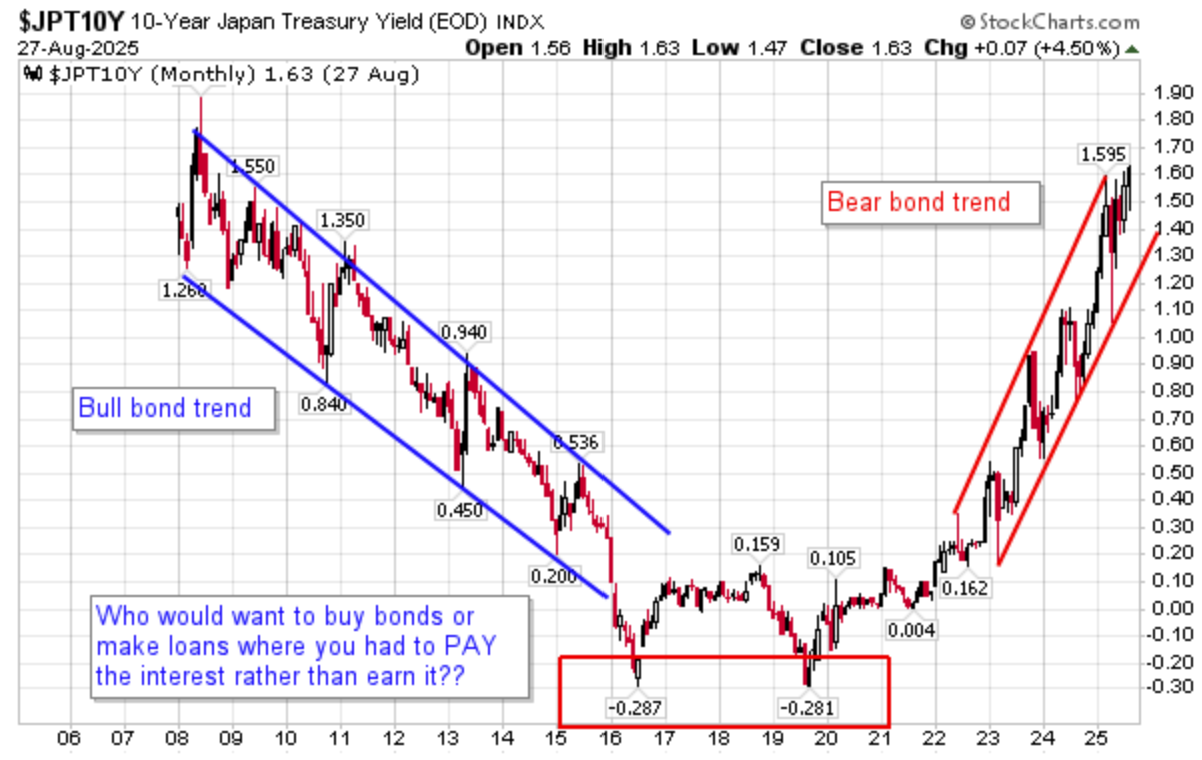
As we can see from the chart above, the Bank of Japan is not getting bond yields to stay low, they have been rising since the trend went negative.

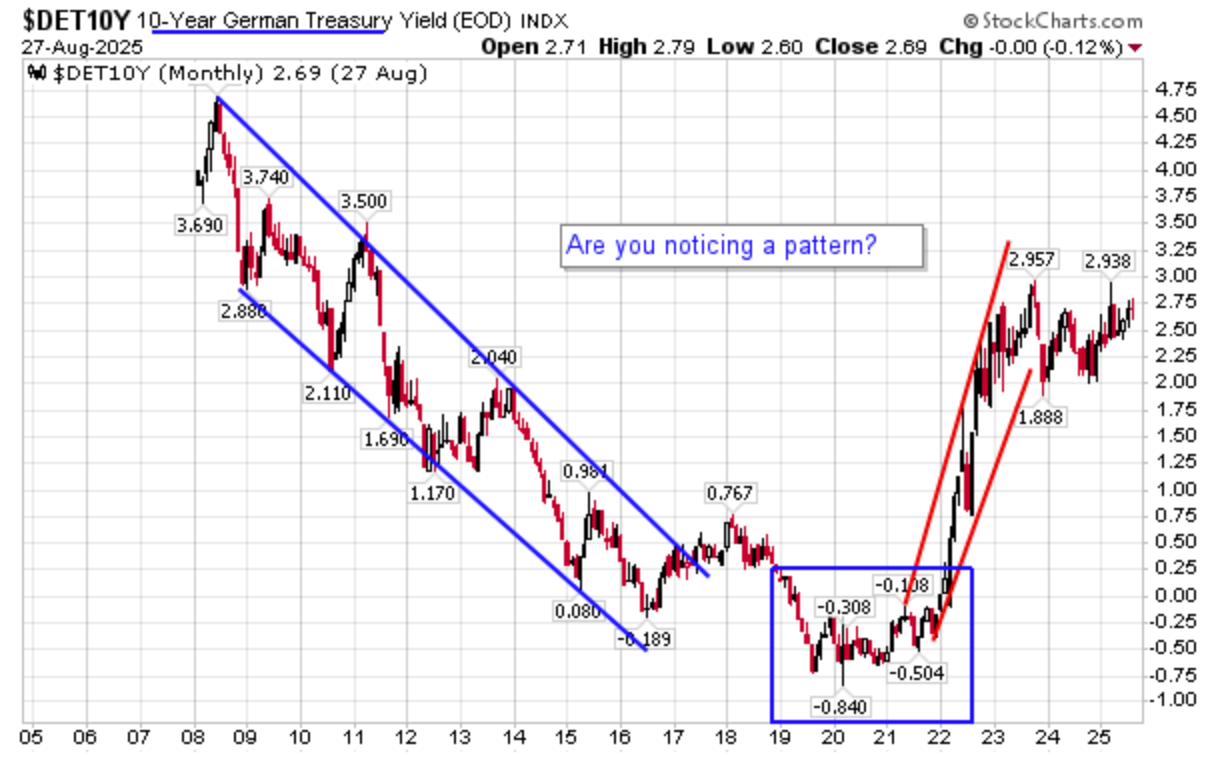
But, as we can see from German government bonds, they are not able to control the yields on their bonds either. Global markets are doing that.

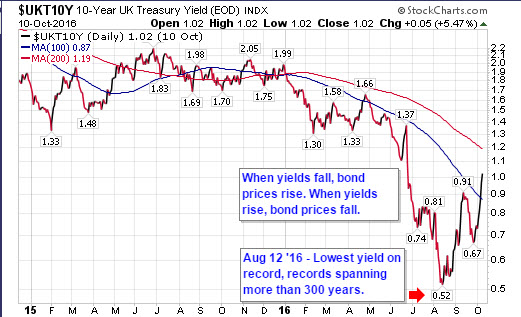
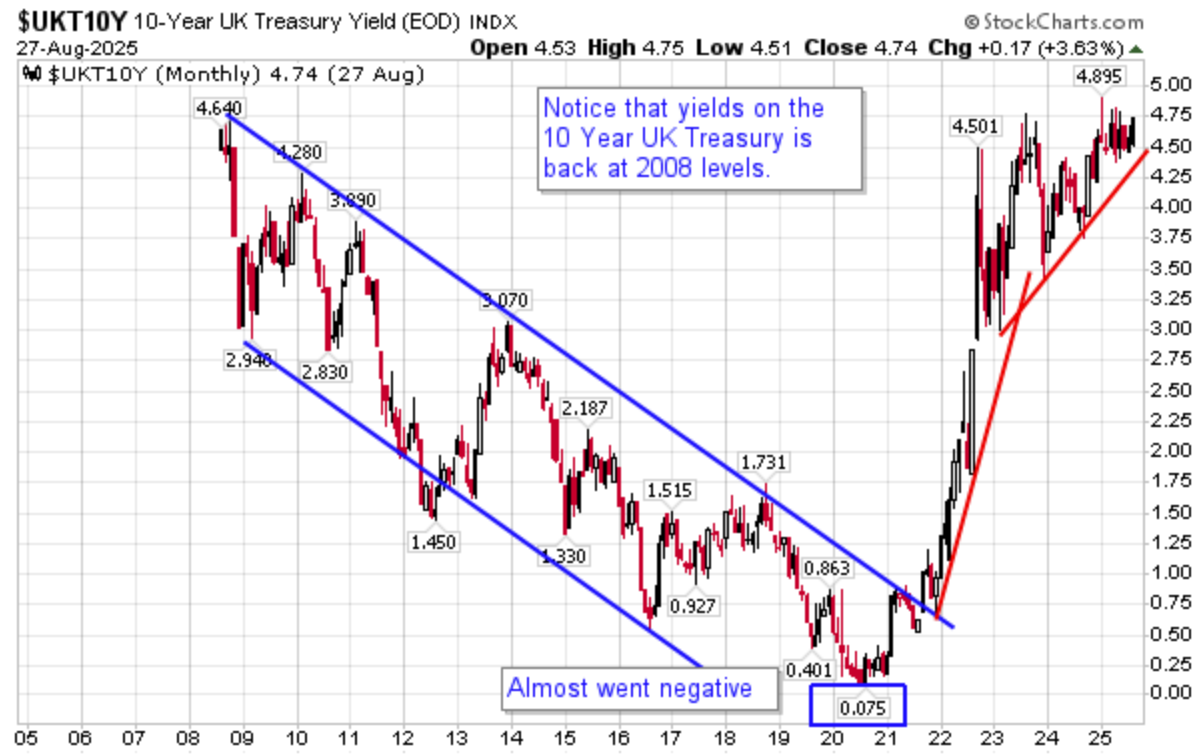
And “The City”, the financial center of London since the Bank of England was formed in 1694, is proving their long history in central banking is not helping them as UK 10-year yields have already risen above 2008 yields.

Throughout history, the City grew as an economic powerhouse, with merchants, traders, and bankers establishing their presence. The Bank of England was founded here in 1694, solidifying the City’s role as a hub for finance. Over time, the City’s distinct governance model and commercial environment allowed it to grow into one of the most important financial centers in the world. [The City of London: A Unique Financial Hub and Historic Enclave, Faisal Khan, Oct.17 ‘24]

Conclusion: Fed Rate Seems Certain, Sept 17

With another rate cut by the Federal Reserve on September 17 almost certain, will real world borrowing costs descend?

September Rate Cut No Longer a Conclusion, Statista, Aug 19 ‘25

Powell Signals Likely Rate Cut in Jackson Hole Speech – Igniting Stock Rally, Forbes, Aug 22, ‘25

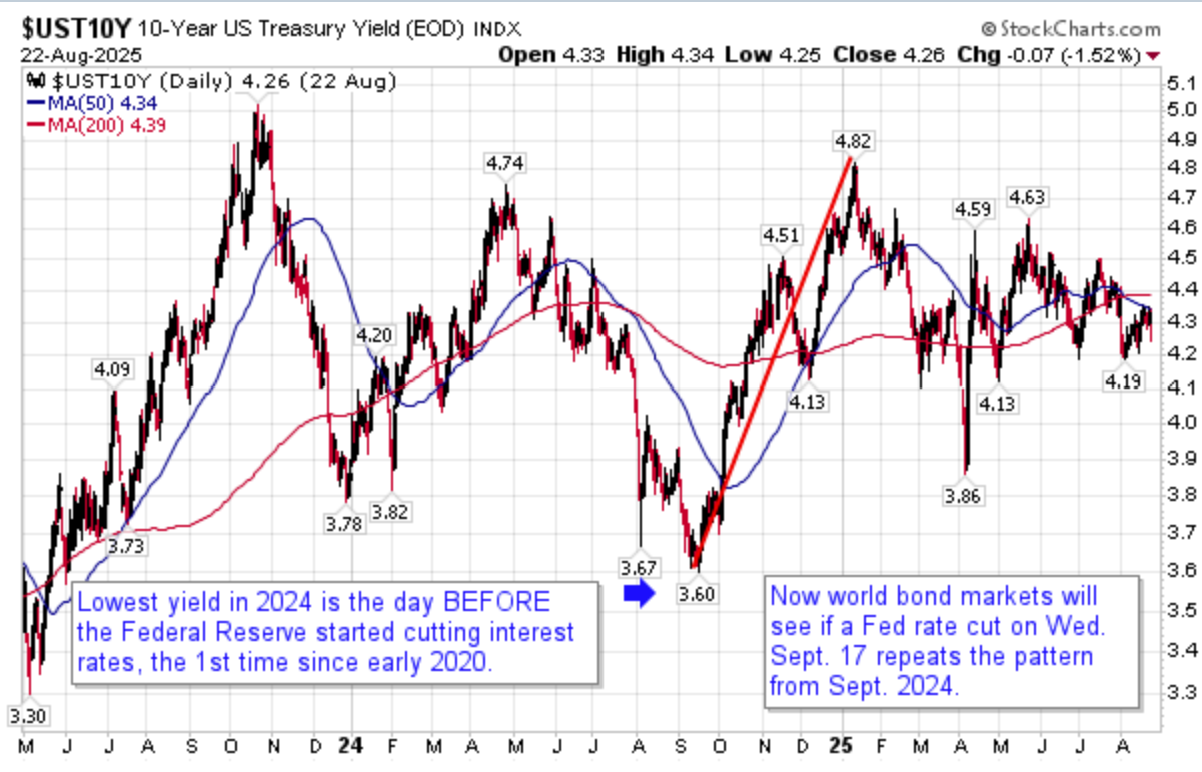
In the fall of 2024 when the Federal Reserve cut the Fed Funds Rate three times. As we can see, the yields on 10 Year US Treasuries did just the opposite.

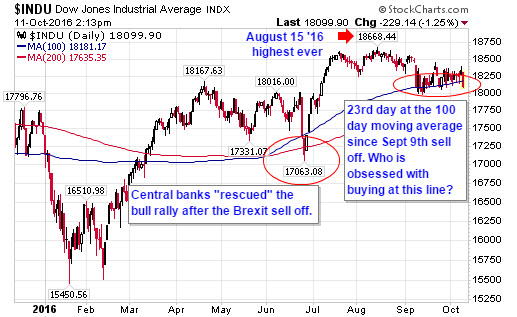
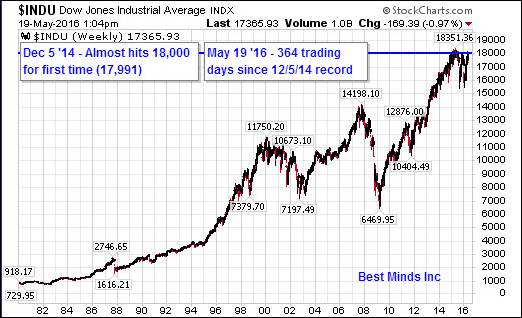
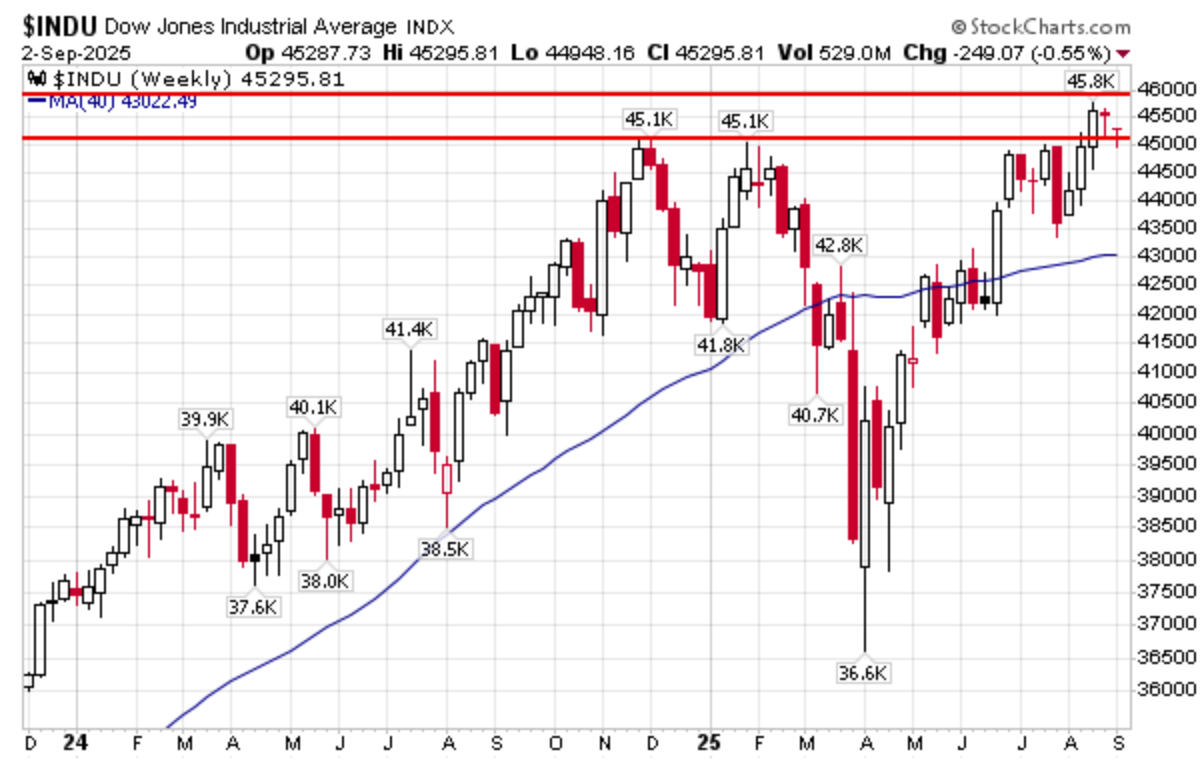
Will the Dow climb higher towards 50,000, or will the 45,000-46,000 range give way to the downside, leaving these all-time high levels?

The one thing that history has already shown us in the last decade is that we have already seen the lowest yields in history. Bull and bear market trends are common throughout the history of all markets. Pretending that with enough market manipulation we can have an eternal stock rally and return to the lowest yields in history appears to me extremely unlikely and almost a “religious” devotion to the modern day “money making wizards”.

As I wrap up this post, I am reminded of a post in late 2018 by John Rubio who started the website, Dollar Collapse. At that time, Rubio stated in an article that all the major equity indices in the US – Dow 30, NASDAQ 100, and S&P 500 – had reached their longest bull markets on record. We are now 7 years past those records.

I found this chart on their website in an article by Graham Summers, another name with a long history in writing market commentary. “Put another way, the era of ever cheaper debt is OVER. For the first time in 45 years, it is costing the U.S. MORE to issue new debt

(or roll over old debt).[Bold text is the author’s] [The Single Most Important Chart in the World is Flashing “Danger”, Graham Summers, Sept 1, 2025]

We continue to watch…and watch closely. Be on alert my friends.

“Do not lay up for yourselves treasures on earth, where moth and rust destroy and where thieves break in and steal, but lay up for yourselves treasures in heaven, where neither moth nor rust destroys and where thieves do not break in and steal. For where your treasure is, there your heart will be also.” Matthew 6:19-21

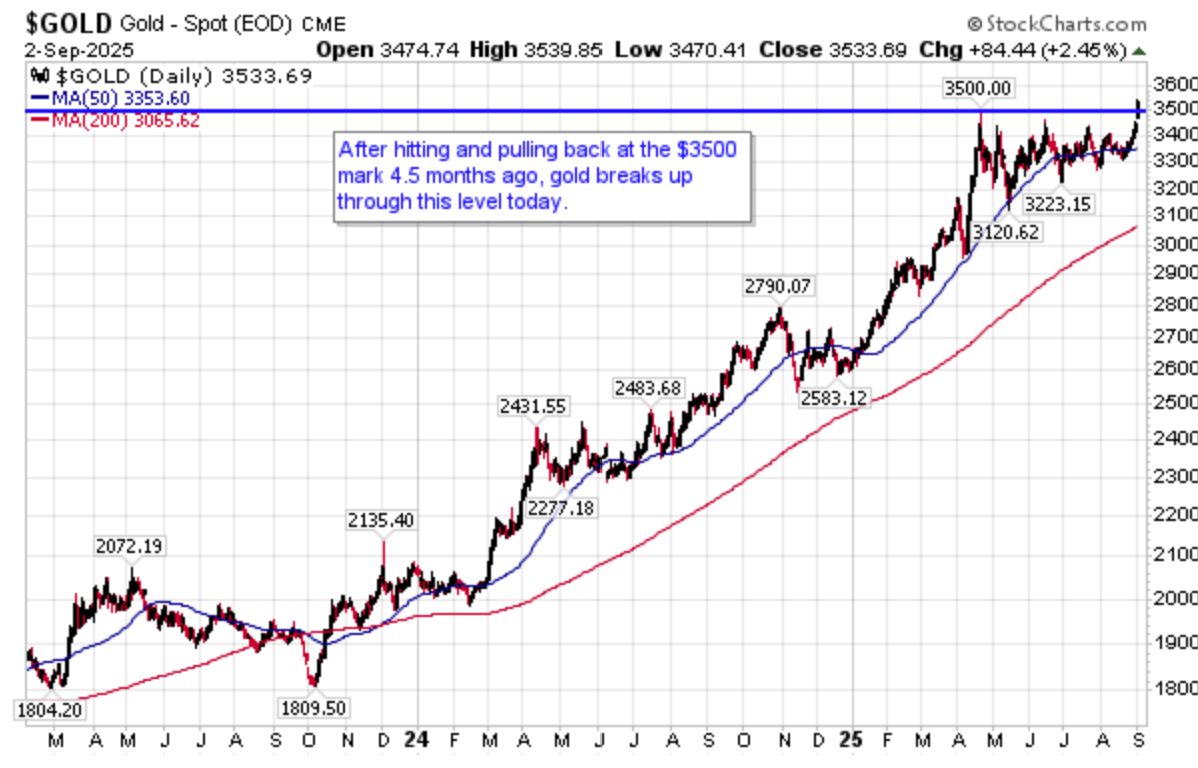
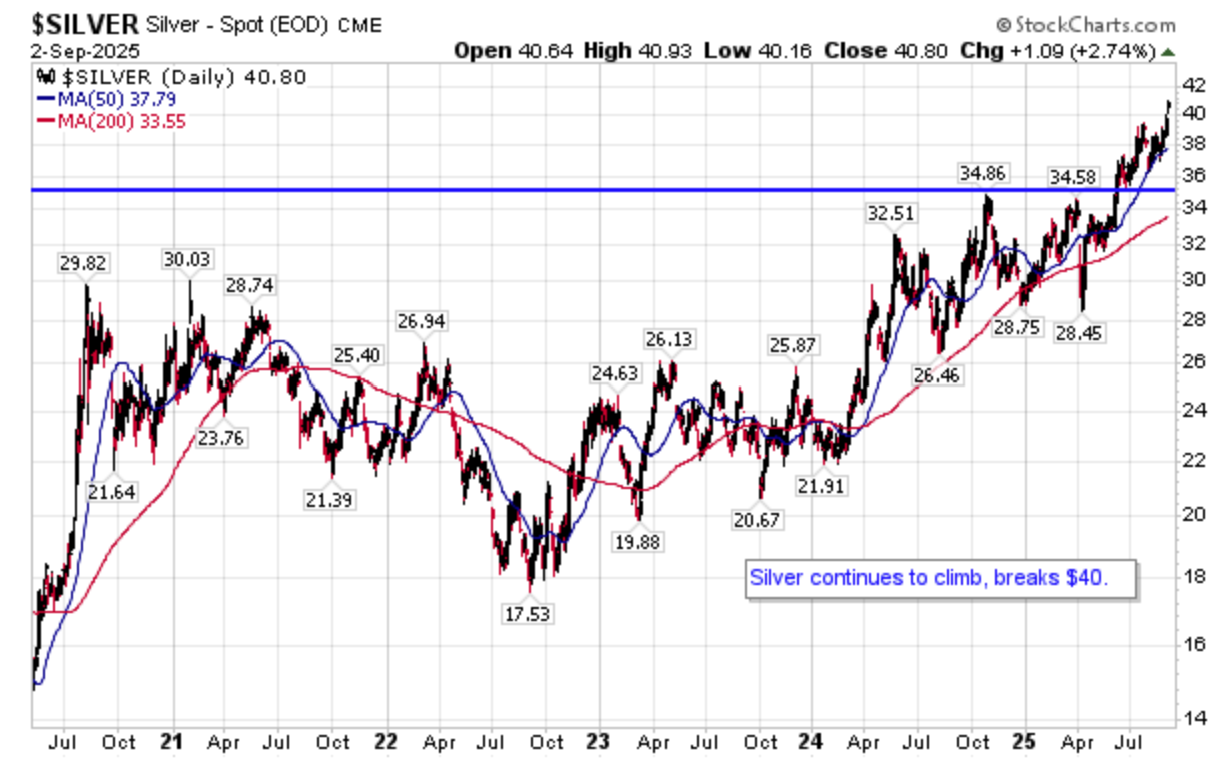
Extra: Sept 2 – Gold and Silver break out about $3500 and $40 respectively.

Trillion Dollar Pictures

To the World of 2024,

It would appear that our time in this maddening central banking experiment is ticking down. For that reason, I am going to post pictures with few comments until history gives us world headlines to post.

First is a picture from news service Zero Hedge, comparing the size of the derivatives book of banking giant Deutsche Bank in September 2016 with the Gross Domestic Product of the entire nation of Germany and the GDP of the entire European Union. [The Run Begins: Deutsche Bank Hedge Fund Clients Withdraw Excess Cash, 9/29/16]

germangdp_eugdp_db-derivaties-sept9-16-zh

Next, is a chart from Tom Fitzpatrick of Citigroup just released. Once again, the source was a post from Zero Hedge. [The Chart That Give Citi “The Chills”, Oct 10]

oct10_zh_citi_sp500-2016vs1987

The third picture reveals that on August 12, 2016 world markets saw THE lowest yield on the 10 year British Gilt ever in history, records spanning more than three centuries. These yields have risen sharply (prices falling) since then.

oct11_ukt10y

My next chart shows that since reaching its all time high on August 15, 2016 (18,668), the Dow Jones Industrial Average has repeatedly stopped declining after falling to its 100 day moving average on September 9th. There is no way a worldwide crowd of investors could randomly repeat a pattern at a technical line this many times. This would make sense if powerful high speed computers halted the decline around this level repeatedly. 

oct11_dow_100day

Are we looking at the final day the Dow was above its 100 day? Could price and experience change soon?

As you look at the pictures above and the postings since 2014 on this blog, you can see why I am so concerned about the world of price illusion from central banking intervention while the global economy we all live in daily continues to slow.

20161010_weber

Alex Weber, Chairman of global banking giant UBS, also a former President of the German Bundesbank, made these comments recently. They once again remind us that a knowledge of the financial world and history is of value, even when an experience provided by constant intervention gives us the false sense of a world without risk.

“They (central banks) have taken on massive interventions in the market, you could almost say that central banks are now the central counterparties in many markets. They are the ultimate buyers…


Investors have been driven into investments where they have very little capability for dealing with what is on their plate and I think that is a sure reminder of where we were in a different asset class in 2007.”

Hang on. The pressure to our thinking and feelings is rising.

A Curious Mind


The “Experience” Market Bubble

May31_Secret

“There is truth deep down inside of you that has been waiting for you to discover it, and that Truth is this: you deserve all good things life has to offer. You know that inherently, because you feel awful when you are experiencing the lack of good things. All good things are your birthright!” – The Secret (2007), 41 weeks in top the five NY Times Hardcore Advice List; it opens my article, Fear and Perception, released on November 1, 20017, two days after Hong Kong’s Hang Seng stock index hit its highest level ever. So much for “all good things” being a “birthright”.


Four months earlier, on Thursday, July 19, 2007, I released a group email to all paid and free subscribers of Best Minds Inc. The email stated the following:

“Evidence is mounting that we are in the final throes of this worldwide, credit-fueled bubble. The wobbling dominoes certainly merit the attention of all investors and advisors.”

That same day, the Dow closed above 14,000 for the first time. It began its descent the next day, but roared back up to close 8 days above this level in October 2007 before starting its downward march through what is now known as the Great Recession. It would take until February 1, 2013, and the public watching the largest ongoing bailout of global banks ever, before the Dow would once again close above 14,000.

So if investors wanted to “experience” wealth, why was July 2007 a harbinger that their wealth was about to be taken from them? Because financial facts at the top of financial bubbles are very different from financial feelings.

By July 2007 I had already seen the Philly Banking Index decline since February. I had contacted a few of my Wall Street level sources for areas I should be watching. One individual told me to pay close attention to two big hedge funds at Bear Stearns that were close to being shut down. Their total value at the end of 2006 was close to $20 billion. On July 16, 2007, the two funds were closed. One source stated that one fund’s assets were valued at zero and the second at 9 cents on a dollar.

July20.07_Dow

July20_BKX


Two Big Funds At Bear Stearns Face Shutdown, WSJ, June 20, 2007

“Two big hedge funds at Bear Stearns Cos. were close to being shut down last night as a rescue plan developed over several days fell apart in a drama that could have wide-ranging consequences for Wall Street and investors.

Merrill Lynch & Co., one of the hedge funds’ lenders, said it would move to seize collateral — much of it mortgage-backed debt — from the two funds and sell it, according to documents reviewed by The Wall Street Journal.”

Since this is all history now, everyone can say, “Oh, I knew that the markets were going to fall.” However, in July 2007, the mood was very different.

On Sunday, July 22nd, I ran into a financial advisor at my church. He had signed up for my free educational services, so had received the group email on the 19th.

“Hey, are you still looking for a collapse?” he said sarcastically.

“We all have our opinions”, I stated, and walked off.

A few weeks later, anyone reading headlines knew we had entered a credit crisis. However, since we are wired to desire more, and the financial industry feeds the idea that every decline is merely a correction before soaring higher, by October, breaking 14,000 again was seen as normal, and looking for prices to be cut in half seen as nothing more than “naysayers”.

July17_Dow

July2009_BKX

However, we all know today, that history was about to change the perception of investors in 2008. By the time these comments were made by President George W. Bush to the American people, we had already seen the collapse of Bear Stearns in March and the bankruptcy of Lehman Brothers and the nationalization of AIG in September. Like today, these events did not come because there were no financial facts supporting we were living in a financial bubble in 2007, but because the feeling from rising prices built on “unlimited” cheap debt was far more “positive” while it lasted.

[President George W. Bush, The Economy & The Bailout: Primetime Address to the Nation, Washington, DC, September 24, 2008]

“Good evening. This is an extraordinary period for America’s economy. Over the past few weeks, many Americans have felt anxiety about their finances and their future. I understand their worry and their frustration. We’ve seen triple-digit swings in the stock market. Major financial institutions have teetered on the edge of collapse, and some have failed. As uncertainty has grown, many banks have restricted lending. Credit markets have frozen. And families and businesses have found it harder to borrow money.


We’re in the midst of a serious financial crisis, and the federal government is responding with decisive action….


In close consultation with Treasury Secretary Hank Paulson, Federal Reserve Chairman Ben Bernanke, and SEC Chairman Chris Cox, I announced a plan on Friday. First, the plan is big enough to solve a serious problem. Under our proposal, the federal government would put up to $700 billion taxpayer dollars on the line to purchase troubled assets that are clogging the financial system. In the short term, this will free up banks to resume the flow of credit to American families and businesses. And this will help our economy grow….”

It is no longer September 2008. It is now June 2016. The problems from the ultra cheap loans into the trillions that lead to the credit crisis of 2008 were never addressed. Global debt is now over $200 trillion, an increase of over $60 trillion since Q4 2007 when the Dow left its 14,000.

At the end of May 2016, the Dow is still hanging close to its all time high from over a year ago, and yet has seen two plunges from its 18,000 twice, both declines taking the Dow down over 2500 points in less than a month.

Yet even the most powerful financial organizations in the world continue to reveal that 7 years of “unlimited debt and intervention” have not created a strong growing economy.

The IMF Slashes World Growth Forecasts Again, CNBC, April 12, 2016

Global growth continues, but at an increasingly disappointing pace that leaves the world economy more exposed to negative risks. Growth has been too slow for too long,” IMF Chief Economist Maurice Obstefeld told a media conference on Tuesday, according to prepared remarks.

G7: Global Economic Growth An ‘Urgent Priority’, Al Jazeera, May 27, 2016

The leaders of the G7 group have said the world economy is an urgent priority and cautioned that a British vote to leave the European Union would seriously threaten global growth.

Act Now, Or Risk Another Deep Downturn, OECD Warns Policymarkets, Yahoo Finance, June 1, 2016

In the OECD’s (an international economic organization of 34 nations) latest economic outlook published on Wednesday, the organization said that global growth had “languished over the past eight years as OECD economies have struggled to average only 2 percent per year, and emerging markets have slowed, with some falling into deep recession”….


“The need is urgent. The longer the global economic remains in the low-growth trap, the more difficult it will be to break the negative feedback loops, revive market forces, and boost economies to the high-growth path. As it is, a negative shock could top the world back into another deep downturn,” Mann said.

World Bank Cuts Global Growth Forecast on Weak Demand, Commodity Prices, Financial Express, June 7 ’16

The World Bank slashed its 2016 global growth forecast on Wednesday to 2.4 percent from the 2.9 percent estimated in January due to stubbornly low commodity prices, sluggish demand in advanced economies, weak trade and diminishing capital flows….


The downgraded World Bank forecast follows a similar move by the International Monetary Fund, which cut its growth forecasts two months ago.

May2016_Dow

May2016_BKX


With all the strong concerns about the global economy slowing from the world financial organizations listed above, shouldn’t both investors and advisors be asking WHY does the Dow keep returning to its first in history 18,000 level, and ignoring headlines like the ones above?

Remember 2007 when the Dow went to 14,000 for the first time in 2007? Remember how the KBW Bank Index was dropping months ahead of the broader US stock indices. As of May 31, 2016, the KBW Bank Index, after two big drops, and two big rallies, is still down 12.4% lower than its 2015 high. Are the big banks telling everyone something?

Unlimited Debt and State Intervention Was Wrong From the Start

We are quickly running out of time to sit silent and ignore this 800-pound gorilla. We must choose between two paths. The first is to continue to ignore this problem, the lessons from the 2000-2002 and 2007-2009 collapse, and the destruction straight ahead to the lives of people all over the world. We must embrace the expansion of the state and the constant “assistance” we have seen since 2009 by central banks around the world through additional trillions in ongoing bailouts in our financial markets, even the direct actions to buy up certain markets in order to artificially inflate them for a few years.

The second is to face these real world problems. We must start quickly by talking about these problems, that will impact every individual, community, school, and place of worship across our nation, and for that matter, world.

Will we speak out? Will we sit silent? One thing is for certain, hoping for more corruption of our markets and economy by central bankers and global politicians is immoral.

The trouble is finding ways to talk about what our globalist, materialist centered world has come to believe is permanent, which never was: the path to riches from bankrupting the nations.

Everyone needs to consider the hard facts presented in one of my recent articles, When Rare Data Screams, Listen. Anyone who remembers the double-digit CD rates from the early 1980s really needs to check this one out. This is history!

image014

* 1981 – Annual high in the Dow was 1,050. US national debt crosses $1 trillion for the first time. 2015 – Annual high in the Dow hits 18,351 on May 19th. The last day of 2015 the national debt hits 18.9 trillion.


A Curious Mind